Jitsi Videobridge Performance Evaluation
by Boris Grozev and Emil Ivov
So we hear Jitsi Videobridge is super efficient and scalable …
How efficient do you mean exactly?
If you are thinking about using Jitsi Videobridge or any kind of a Selective Forwarding Unit (SFU) the first legitimate question would be: what load will it be able to handle? After all, performance and cost are the main reasons you are ditching your video mixer (MCU), so you want to make sure that Jitsi Videobridge gets you at a better place.
Congratulations! If you think your video MCU was giving you a somewhat slow ride, with Jitsi Videobridge you just boarded a supersonic jet!
How about we get to the point? Could we please see actual numbers?

Fair enough! Before we get to a full description of our performance testing, let’s first see a representative summary of all results:
On a plain Xeon server (like this one) that you can rent for about a hundred dollars, for about 20% CPU you will be able to run 1000+ video streams using an average of 550 Mbps! Check the graph below!
Want to know more? Read on!
We performed all tests on an unmodified Jitsi Meet installation, on a dedicated server. The server is running all the services needed by Jitsi Meet: a web-server (nginx), an XMPP server (prosody) and Jitsi Videobridge. The server machine is equipped with a quad-core Intel ® Xeon® E5-1620 v2 @ 3.70GHz CPU.Let’s first have a look at our testbed
- conferences — the number of active conferences.
- endpoints — the number of total load-generating endpoints in all conferences.
- cpu_usage — the load of the CPU (all cores) during the last interval. This is the fraction of time spent by the CPU in one of the following states: User, System, Nice, IOWait (this is what is shown on the “%Cpu(s)” line in top(1))
- network_in — the receiving bitrate, measured by ifstat on (independent) 2-second intervals
- network_out — the sending bitrate
The following variables are extracted from the above:
- bitrate — the sum of network_in and network_out, converted to Mbps (10^6 bits per second).
- streams — the total number of audio/video stream couples being sent by Jitsi Videobridge. This depends on conferences, endpoints and other considerations (whether there are endpoints which do not send data).
For the test we ran a single Jitsi Meet conference with increasing number of endpoints (K). We used one instance of Chrome, running the actual Jitsi Meet application and serving as the conference “focus”. This first endpoint had the camera and microphone muted. For the rest of the endpoints (K-1) we used Jitsi Hammer instances, each streaming a pre-recorded audio and video file with a combined average bitrate of about 515 Kbps per endpoint.
A sample test scenario
One challenge when evaluating Jitsi Videobridge is getting to send enough traffic to actually make it break a sweat. Using browsers to populate enough conferences would likely take hundreds or even thousands of machines so that’s obviously not an option.
What we did instead is to create a conference with a full-star topology where incoming traffic from any and every endpoint is being propagated to every other endpoint connected to Jitsi Videobridge. With this configuration we have K*(K-1) streams leaving the videobridge (and K-1 arriving).

We ran tests with different numbers of load-generating endpoints and K = 10, 15, 20, 25, 29 and 33.
The number of actual video streams increases quadratically with the number of load-generating endpoints, because each of the endpoints also acts as a destination that traffic from everyone else needs to be encrypted and delivered to. Note that in practice one would never want to run a conference that way:
In a conference with hundreds of participants, no one would want to see them all at once. First, this would be hugely inconvenient. You only need to have a look at the screenshot below to see what we mean.

Secondly, it would also require users to have ridiculous amounts of download bandwidth. Usually, for large-scale conferences, people would want to use Jitsi Videobridge’s Last N mode so that only the most recent speakers would be distributed and shown.
Once again though, our purpose here is to generate load so stream count and bitrate are the numbers that really matter. Once we get a specific evaluation for a given stream count, it wouldn’t matter what number of endpoints they were sent to. In other words, 1000 video streams cost the same amount of CPU and bandwidth, regardless of whether a thousand endpoints were getting one stream or if a hundred endpoints were getting ten each.
More detailed evaluation results
Now let’s get to the gist. The following graphs show the bitrate, CPU usage and number of video streams (or rather audio/video stream couples) observed during our two test runs.
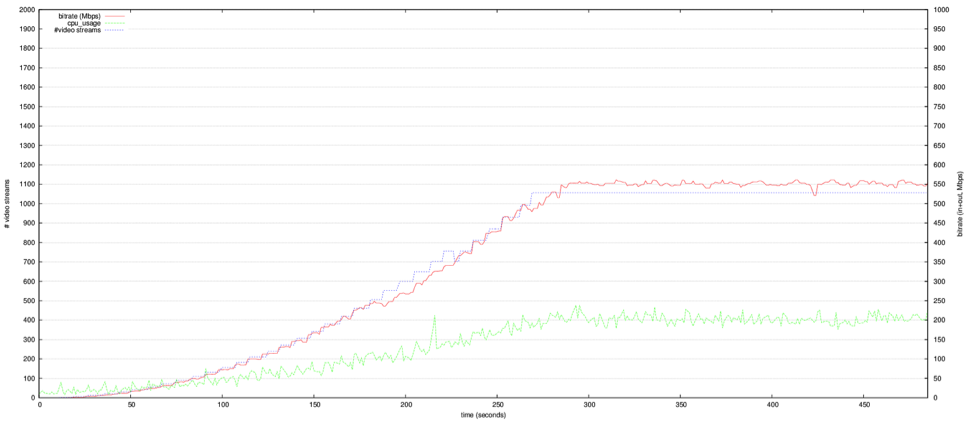
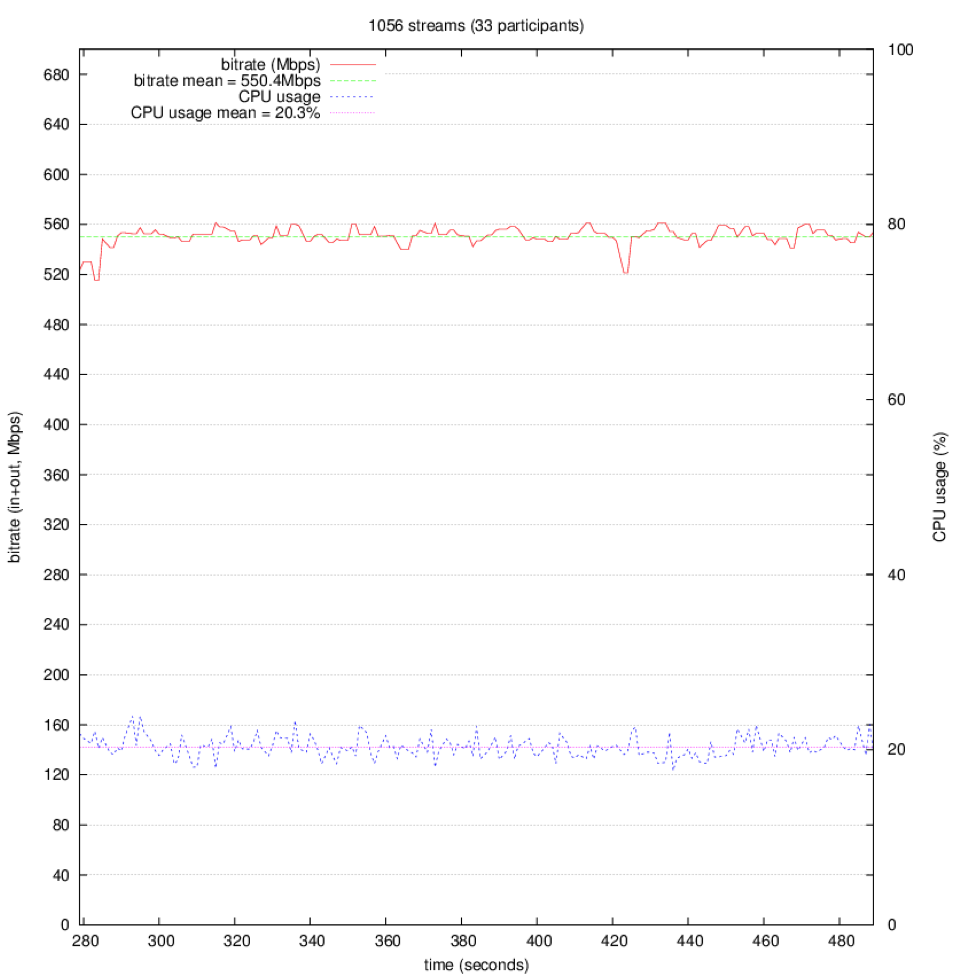
In this run we used thirty-three load generators and caused Jitsi Videobridge to distribute 1056 streams (i.e. 1056 video and 1056 audio streams). Bandwidth usage reached over 550Mbps. The CPU usage in the above graph is scaled so that 100% would be at the very top of the Y-axis. We see how the 1056 streams end up taking about 20% CPU.
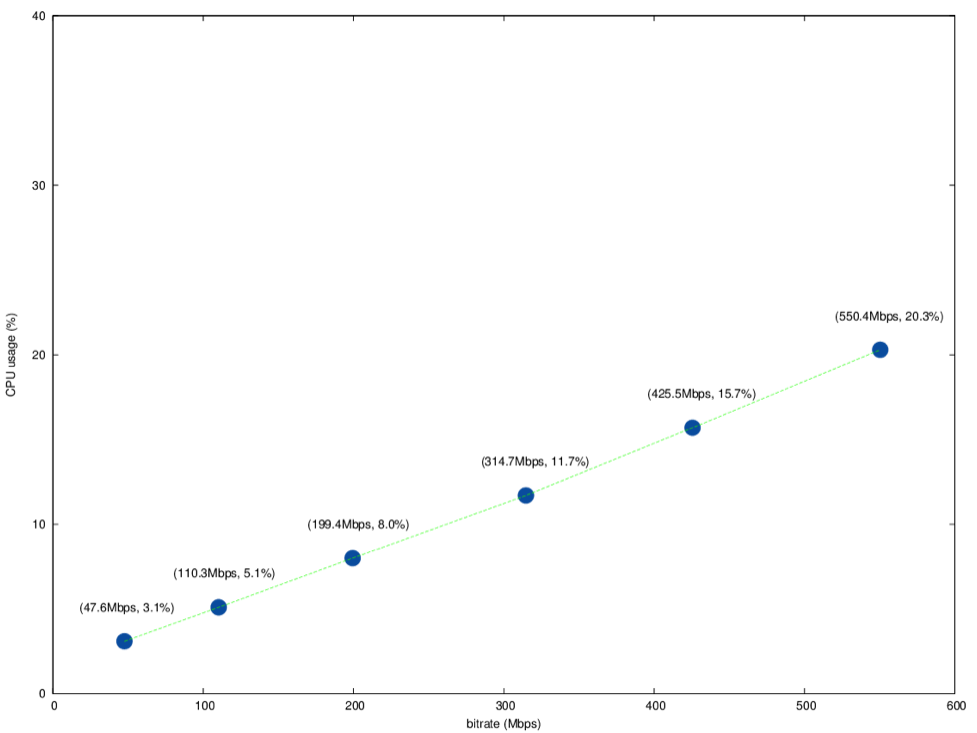
We calculated the average bitrate and CPU usage observed during various test intervals with a constant number of load generators and streams. The results are summarized in the following graph. The full details can be found at the end.
Let’s now see what all of this means exactly.
We see that, as expected, the CPU usage increases nearly linearly with the total bitrate.
Note that even though our tests used a single conference, it had 1056 video (and also 1056 audio) streams going out of the videobridge. This generates a bitrate roughly equivalent to 528 one-to-one conferences, 176 3-person conferences or 53 conferences with 5 people.
While we didn’t specifically show the memory consumption during these tests, it is worth noting that that Java virtual machine was always run with a 3GB memory limit, and it never exceeded this. In fact, during our tests, the RSS of the Jitsi Videobridge process as reported by ps(1) never exceeded 1500MB.
These results show that Jitsi Videobridge is able to handle a substantial bitrate with relatively low usage of resources, and that it scales extremely well with the bitrate/number of streams.
More graphs for those that really want a deep look
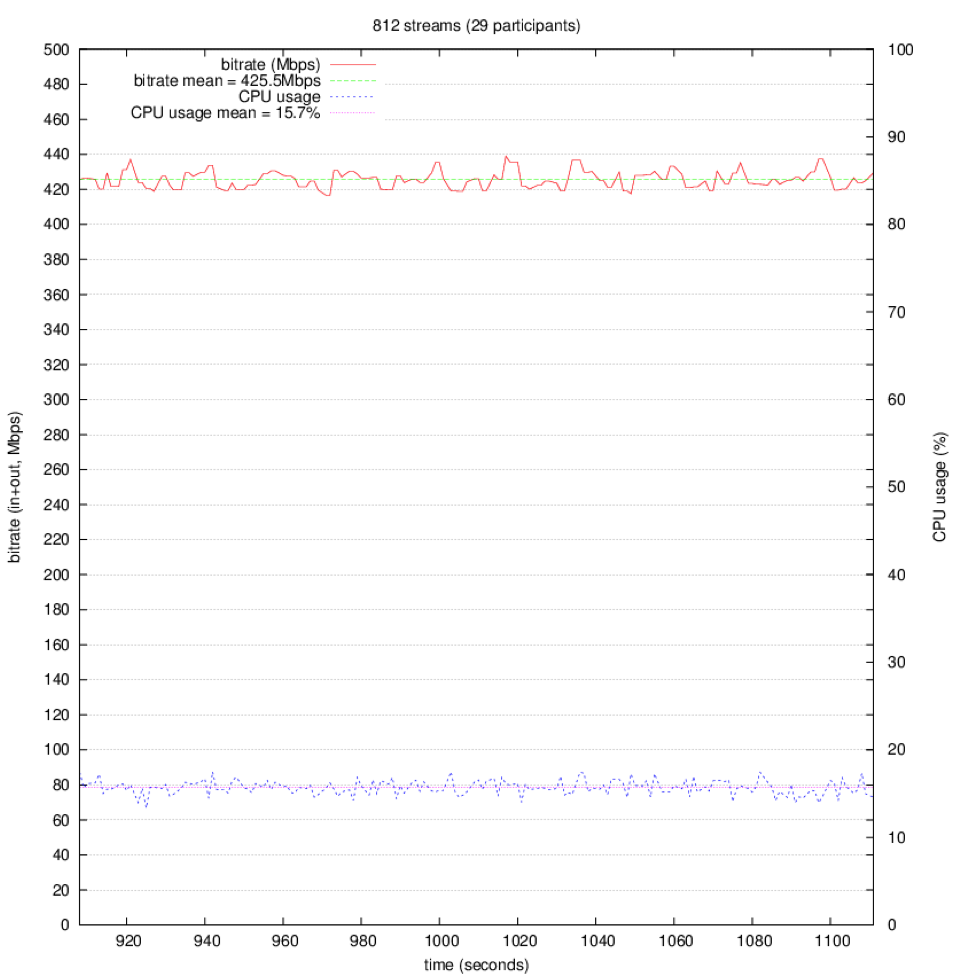
In the following run we started with 10 load generating endpoints (90 streams), then increased them in groups to 15, 20, 25 and finally 29, which gives us a total of 812 streams.
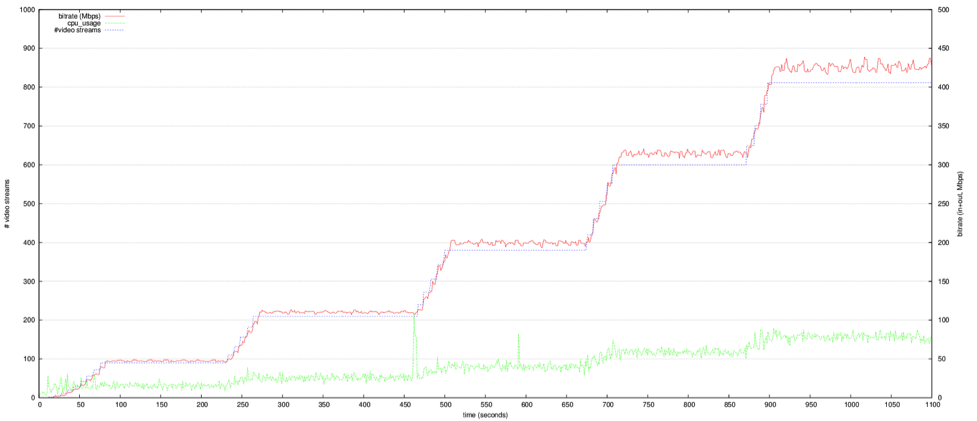
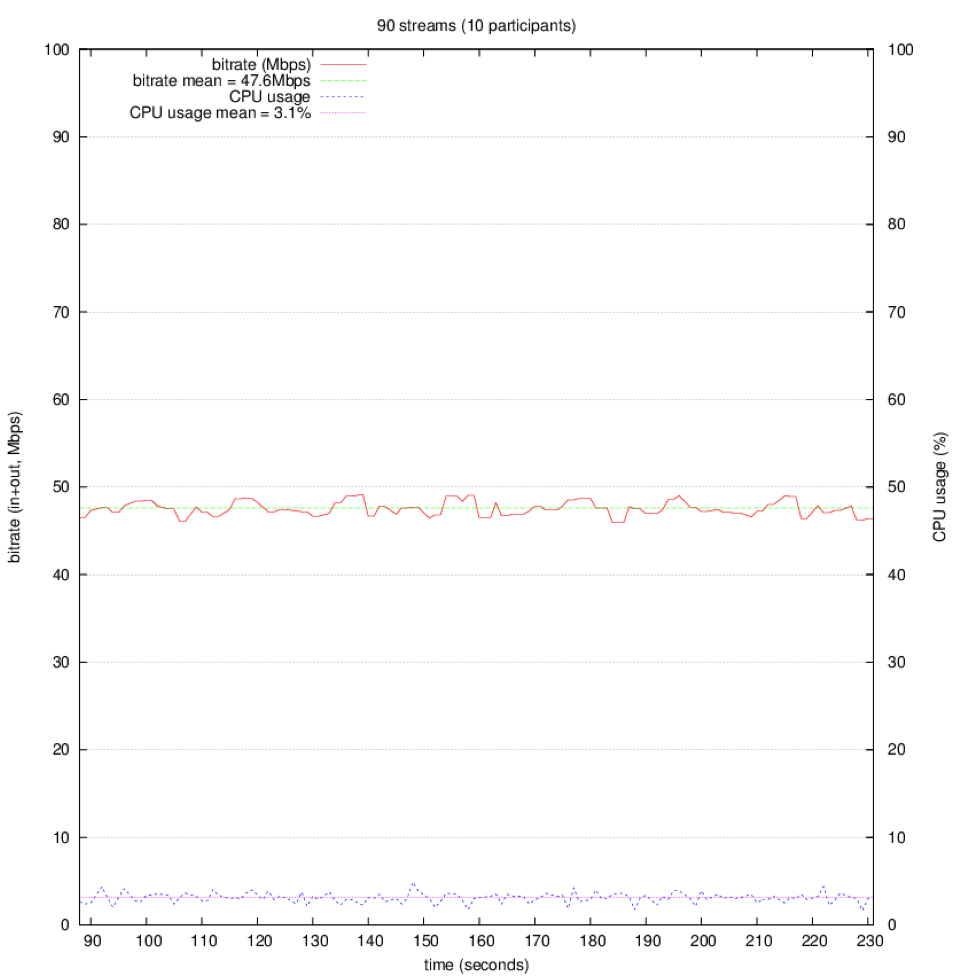
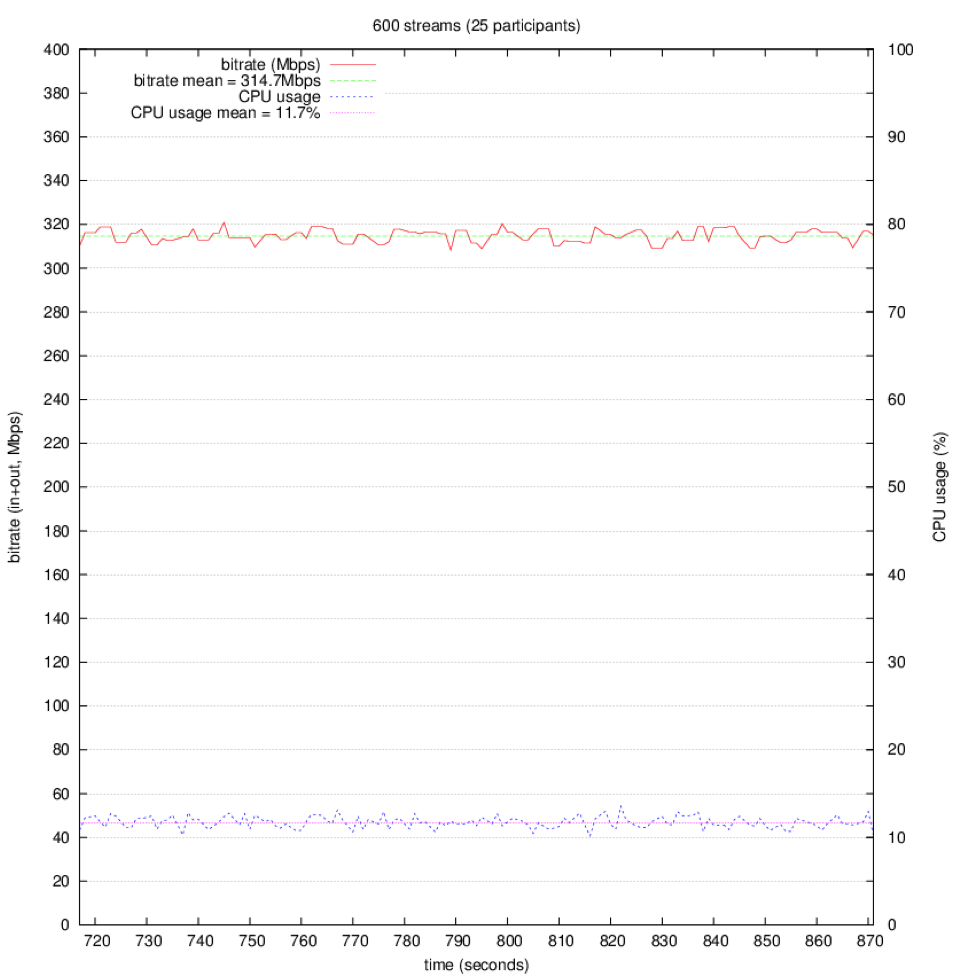
The next graphs zoom in on the intervals used to calculate the averages (during the periods where the number of endpoints/streams stays the same). We can see that the CPU usage stays very stable in these periods.
 |
 |
 |
 |
 |
| 90 Streams Bitrate mean: 47.6Mbps CPU usage mean: 3.1% |
380 Streams Bitrate mean: 199.4Mbps CPU usage mean: 8.0% |
600 Streams Bitrate mean: 314.7Mbps CPU usage mean: 11.7% |
812 Streams Bitrate mean: 425.5Mbps CPU usage mean: 15.7% |
1056 Streams Bitrate mean: 550.4Mbps CPU usage mean: 20.3% |